IoT in Healthcare Use Cases eBook
Download Your Free IoT in Healthcare Use Cases eBook
Read More


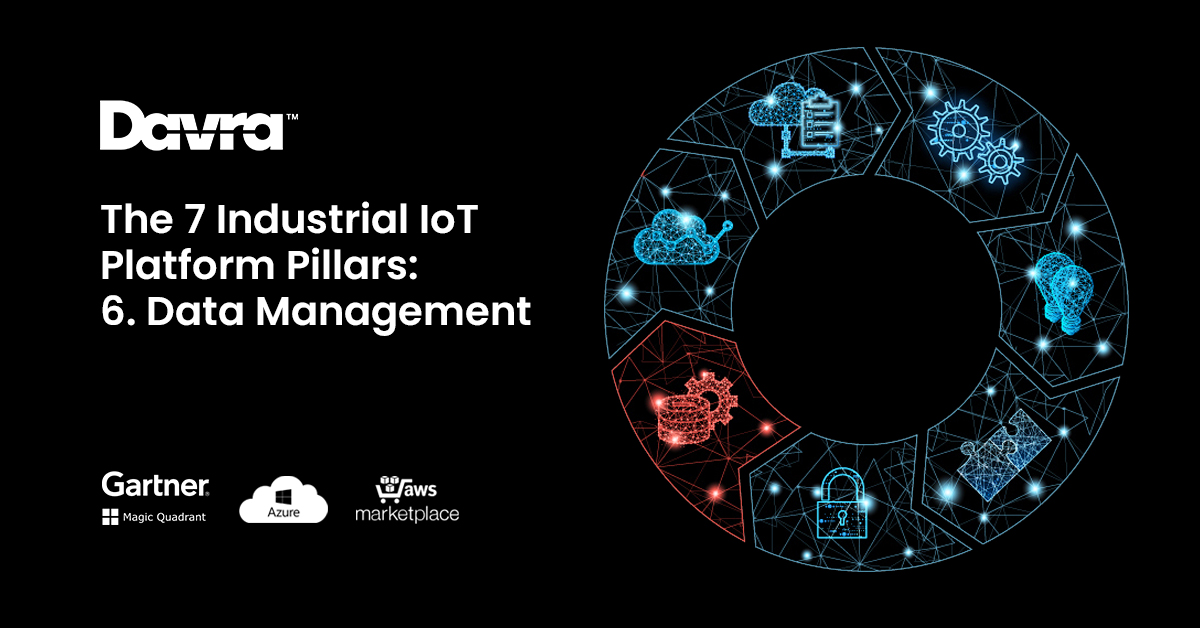
Compared to consumer IoT devices, Industrial IoT solutions are device-light but ingest significantly higher amounts of data. Thus, the management systems put in place to consolidate and draw benefit from the data need to be robust and flexible. In today’s sixth pillar blog post on the function data management, we will be going through IoT endpoints, data accessibility, data flow architecture, and the data pipeline.
According to Gartner, data management develops the following benefits:
“The data generated by IIoT sensors is often critical to the operation of end devices and may also contribute to the safety of the environment… to address security, emphasising uptime and minimising data loss through sophisticated and segmented network design. Data also contributes greatly to efficiency and availability targets, which drive cost reductions and extend the useful lives of assets.”
The first key aspect of an IoT platform is that it’s flexible in how it ingests data. Sometimes data is pointed towards you, and you need to put an endpoint to consume this data (in simple terms).
On other occasions, you need to install equipment in an environment and put the infrastructure in place to process the data—for example, Low power wan, LoRa, Narrowband IoT, or Sigfox.
Davra can place IoT gateways in client environments. We must use an SDK on those gateways. The SDK can perform logic to harvest the data, such as talking to a legacy asset over IO or serial ports.
Gateways are suitable for an asset that produces so much data that you can’t send it all to the cloud. Instead, you can just filter it and find what’s essential to send to the cloud. Devices in a remote environment run the risk that the connection isn’t right. You need to collect that data locally and then send it when it gets an opportunity (when it reconnects to the cloud).
Don’t just think of data management at the head end, in an IoT stack, you must think of all the different layers where you need to be capable of performing data management.
If you have a web-enabled AP, that is also somewhere where data can be pulled. The plugin is data where you just point it towards the system, such as the Davra platform, where we have an adapter that we can build on our side to take that data, format it, and put it into our databases.
Video isn’t often considered in IoT, but it is pivotal to many of our use cases in Davra. These are all types of video that can be used on the Davra platform:
• Live video
• Historic video
• Annotated video; a timeline with IoT sensor events
• Video analytics and more advanced methods
There are also voice controls within the platform too. We look at the natural paths users would usually take in their workflows and then visualise the data. We want people to take action on the data, and draw them in in a way that they can collaborate effectively with the data.
The environment where clients are typically storing their data is in excel or SQL database. This can be cumbersome but is still a good data source no doubt. We perform an extract, translate and load function on this old data using the IoT platform to ensure we can always benefit from the historical information already on our client’s system.
No matter how we harvest data from these sources, once it arrives on our platform and we store it, we can analyse, compare, and contrast data precisely as we would with more advanced methods of data storage. From a CSV file or a gateway, the complexity of the harvested data is decoupled from how it’s visualised, analysed, and further processed.
Data storage, persistence, and ingestion need to have the ability to store data at scale. We have databases built into our platform for all the different data types we come across. We then choose the best in class databases for the jobs at hand. For example, Cassandra for time series data storage, Mongo DB for document-based data storage, PostgreSQL for SQL relational data, Elasticsearch for log data which involves data forwarding, sharing and routing. We use Open API for querying data securely and at scale.
Platforms should have safe and precise methods for sending data to other systems. With an IoT solution, to be genuinely integrated into operations in the client’s environment, you need to know the tools they’re using to be able to get the critical findings integrated from our application. For example, a ticketing system that requires a user to take action; we need to figure out how to get the information to them in a way that they usually consume actionable insights. On our platform, we can populate the ticket in someone’s queue with as much information, such as assigning a URL back to our system to allow them to do the ticket data discovery and troubleshooting.
The data pipeline is built around a backbone enterprise message bus. This is the right way to pass data at scale. Restful APIs are useful, but the type of scale we deal with means you can’t give vast amounts of data over Rest. Rest is good for passing control to another system, but if you’re passing data, then you need a message bus.
Examples of data sources coming into the system:
• LoRa/LPWAN or EPM data flow, which then comes into a data collection mechanism. Everything is streamed to a data disk; from the wire to the disk, everything gets replicated onto the message bus.
• Data translation: the various services can subscribe with encoders and decoders for hex payloads.
• Data enrichment: adding labels to the data and adding extra information to the data so it can be queried or secured. This includes any native data that makes sense to attach to your data.
• Data persistence: information that is infrequently accessed and not likely to be modified. It is streamed to the disk.
• Rules engine workers: if this, then that logic. This subscribes to feeds, so it checks for thresholds and moving averages.
• Custom microservices: you inject into the platform that you can subscribe to this message bus and do the processing within that microservice. It’s a bidirectional flow, so can you do your process and publish metrics back. For example, a custom microservice gets four raw data points and does an aggregation across those. We cater to derived data points or a KPI; this new derived metric is published back into the message bus where it then gets replicated through the other services that are subscribed to the derived value, where it will go to the disk or the rules engine.
• Aggregation and caching: common queries, KPI indicators, and moving averages which are then ready for quick querying.
• Data forwarding: take the consumed data and forward it to whatever another system you want to send it. Sometimes the data we need to send needs to be customised.
• Data serialisation: we can do flexible formatting and structuring for the receiving system that expects the data to be formatted a certain way—for example, GDIA analytics, SAP Hana, Cloudera, and Azure SQL.
Opening up data siloes in an organisation is a core component to IoT. There are a lot of siloed solutions where data resides. It is our job to unlock them and get them into a single pane of glass. It’s also crucial to open the people-siloes as well and bring everyone along in the project.
The security aspect also goes across everything; to get the data to route to you, go through firewalls and data collectors, to cloud systems.
A data collector that goes on-premise may not be a gateway, it might be a mini server (an aggregation node), from locally packaging and forwarding to the cloud. In this use case, they have local data sources that we collect from; we also had a provider to them such as Verizon, who was also sharing data with us by sending it to our system.
We unlock these data sources through the triage hub, which is an incidence response system on the Davra platform.
The minimum level of complexity on an IoT platform is visualising your data on a screen, a line chart, for example.
The maturity of the application moves towards making sense of that data. This involves taking your customer on a journey:
• Descriptive analytics: describing the events that occurred.
• Diagnostic analytics: see that this is what happened, and here’s what we think the root cause is.
• Prescriptive analytics: if this is the cause, then this is what you should do. With prescriptive analytics, the system recommends the next action to take.
• Predictive analytics: we’re not reacting, we’re preventing the event altogether by using historical data to figure out when the equipment will become faulty.
With the Davra platform, we always aim to align with how the customer works on the dashboard and figure out how to remedy the user’s problems.
We create apps that are collaboration-focused; which pull in the data and the ticketing information into our side and give much more flexibility in how we make those workflows and actionable insights.
In this example application, we can pull in the Cisco Webex video calls where multiple users jump on a call to fix the problem. When the system flags a problem, it knows which right team needs to get involved. It creates custom workflows around the collaboration and the roles of users. It looks at their standard operating procedures, the team lists, their discussion, links back to the ticket, carries out equipment or faulty checks and analysis.
Because we’ve unlocked the data, we can automatically do the checks on the system to display that in the user’s workflow, so they don’t have to go back and manually do them. This makes it easier to troubleshoot the problem, knowing the system has already checked other sources of potential issues using machine learning and AI checks.
The user can see that one of the checks may look a little uncertain so that the team can dive into that particular check. They can carry out data discovery from here.
All the technical details are brought together. The right people to call into the space to solve the issue. When you keep getting certain types of incidents, the system will learn and in future be able to respond to issues more efficiently (predictive analytics and maintenance).
Other clients use a follow the sun support model; on a particular time of day, the system knows to invite individual team members to solve the issue, because others are not working.
OEE is overall equipment effectiveness; if this shows in the system as passing the checks, then it could be something else that’s awry. The IoT platform has access to all the underlying systems that support the machine, such as the network, we can see that something else might be wrong besides the actual tool itself. IoT platforms unlock the data sets and bring the organisation along to create the overall vision for the business.
The Davra REST API is open, meaning the user interface in Davra is through device management and is all available through the API. If you have a system that can poll us, and receive data, you can also do that with our system through our robust APIs. Sampling, averaging, group bys, and aggregators RPMs, Timestamps and values, accessible format to consume the output, can all be carried out on our system.
The Davra platform is deployable on-premises or in the cloud with identical functionality, giving our clients ease of access to their data with no latency and careful security. If you would like to read about how we compile the other assets of an IoT platform into the Davra solution, please check out our other pillar blog posts.
Download Your Free IoT in Healthcare Use Cases eBook

Davra IoT is the only Industrial IoT Platform Available on AWS Marketplace
Read MoreThe Collaboration of Humans & Robots Has Created The Cobot
Read More